DIC measurements on structural concrete

The ETH Zürich – on of our longstanding customers – provides on the following website their research project. They analyse the accuracy of digital image correlation within the scope of reinforced concrete. To the project members belong Prof. Dr. Walter Kaufmann and Dr. Jaime Mata Falcón.

eth-zuerich-2Full field strain measurement in rebar tension

test: failure phase.

User videos on Youtube – Civil engineering

Ravi Ranade

Test of a ECC (Engineered Cementitious Composites) Beam under 4-point loading.


Ravi Ranade

DIC measurement of a rectangular tensile specimen of High Volume Fly Ash ECC, loaded along the horizontal axis.


National Institute of Standards and Technology

The National Institute of Standards and Technology helps to measure stress in bridges. By using Digital Image Correlation they try to understand, what impact stresses and strains have to the failure or damages (tragic collapse) on the metal connectors for bridges.


Strain Gauge Comparison

In this example a Vic-3D measurement with 5MP CMOS Camera was performed. The acryl specimen is fixed in a tensile testing machine. A strain gauge is attached at the back in combination with a SCAD 500 strain gauge amplifier. The output of the SCAD 500 was connected to the DAQ of the DIC system. The strain results are recorded parallel with the Vic-3D measurement and plotted in a diagram. The camera type is equipped with Sony 5Mpx Pregius sensor, 75 fps.

Strain Gauge Comparison-1  Strain Gauge Comparison-1a

Image 1: Vic-3D measurement of the acryl specimen

Strain Gauge Comparison-2

Image 2: Comparison of strain gauge data (red curve) and DIC Strain data (black curve)

The Vic-3D data match nearly perfect with the strain gauge data. Even at low strains the difference is less than 25 micro strain.

Deformation Measurement

The following video clips show a deformation- or strain-measurement of a metal spring element, measured by using Vic-3D.

The first deformation measurement would be made in the X direction.


The second deformation measurement would be made in the Y direction.


The third deformation measurement would be made in the Z direction.


In the last case you see the result of the strain measurement.

Motion Measurement on Rear Swinging Fork

The video shows the application of a stereo image correlation (phase synchronized) for a three-dimensional displacement measurement or movement analysis (Vic-3D).

The used stereo camera system is based on two 5 Mpixel cameras with a frame rate of 6Hz (at full resolution) in combination with the isi-sys synchronisation and trigger device for stroboscopic opservation of periodic events.

X

Four measurement areas (hydraulic cylinder – below, wheel hub – left, swingarm – middle and linear unit – right above) with specle pattern were monitored for the evaluation. The vector arrows represent the current displacement state.


Combination Stereomicroscope and Vic-3D digital image correlation

Application examples of a special stereomicroscope in combination with Vic-3D digital image correlation on electronic components.

Stereomikroskop

Image 1: Measurement setup

Measurement set up: Stereo microscope mounted on x-y-z-microtable (backside) and tensile machine (right).

Stereomikroskop2

Image 2: Strain in x-direction

Stereomikroskop3

Image 3: Strain in y-direction

Strain distribution of a half cut capacitor-chip (left part) and its soldering area (round section). The board is under
bending load. The board is vertical on the right sight of the image. The local red area is showing a crack in the
soldering part. Image area approx. <2mm.


Lötkugel

Image 4: The main strain of measuring a solder ball d=300µm under horizontal shear stress is shown.


Operation mode analysis on a mobile phone during vibration alert

Nokia3

x

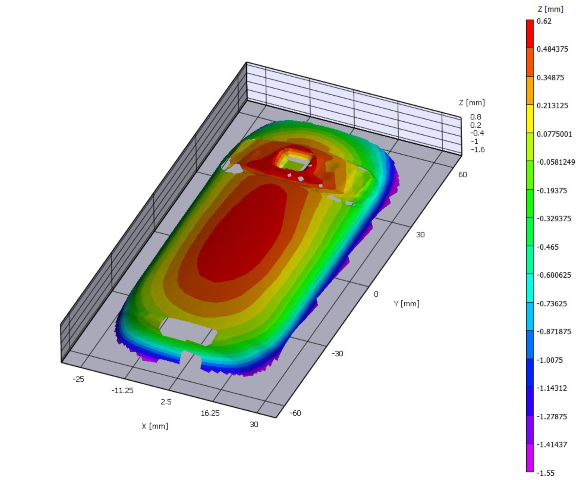
Reference coordinates and contour of the mobile phone.


x


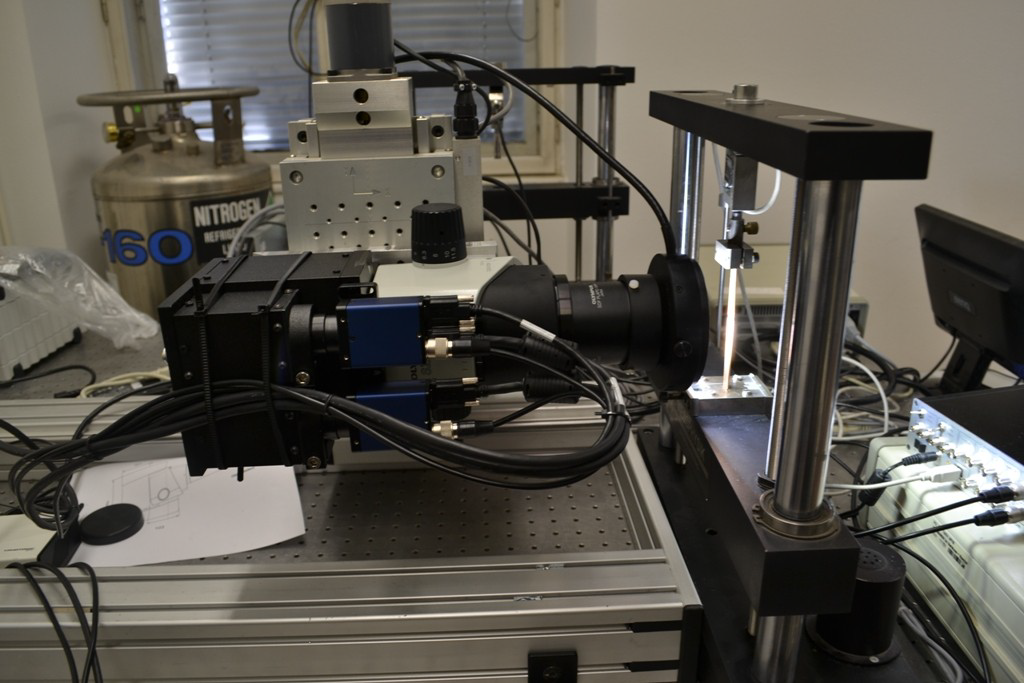
This article describes the measurement and analysis of the operation deflection shapes and rigid body vibration motions of a mobile phone excited by its vibration alert. The mearurement is done, using a non contact, 3D, full-field, high speed stereo image correlation system in combination with the new Vic-3D FFT module analyzes the recorded deformation data in the frequency domain by phase-separation method.

Nokia

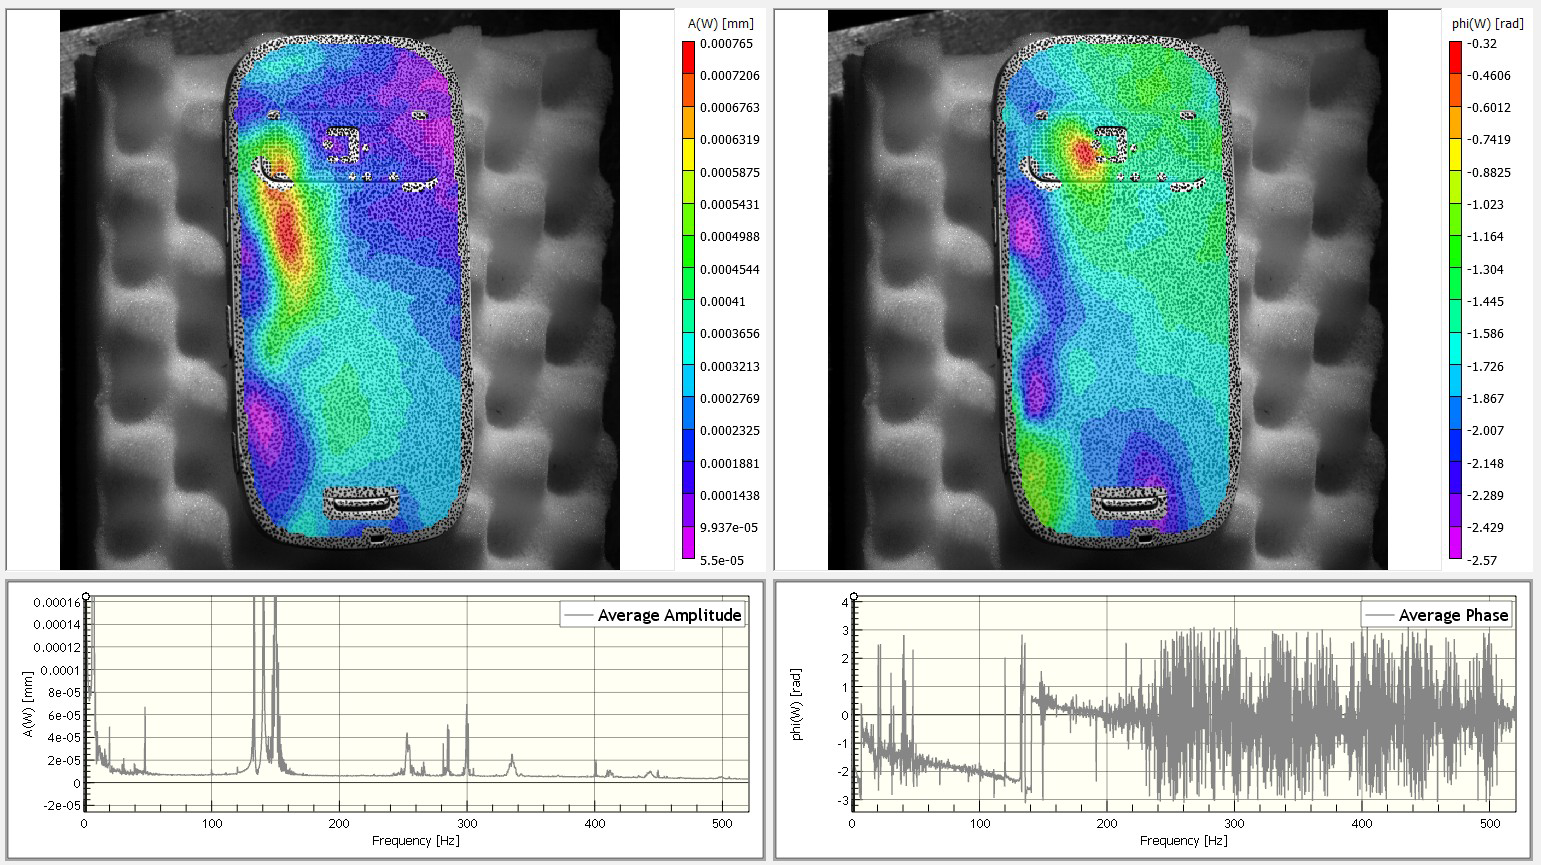
The measured deformations and displacements during the vibration alert are evaluated against the reference state for each stereo image pair. In this case the recording time covers about 5,5 seconds with 1000 FPS corresponding to about 5500 single measurements.

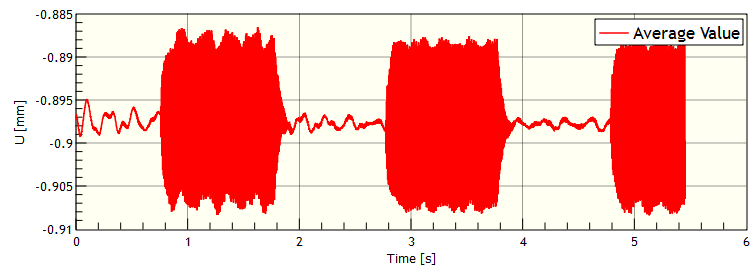
The following figure show the average vibration amplitude U.
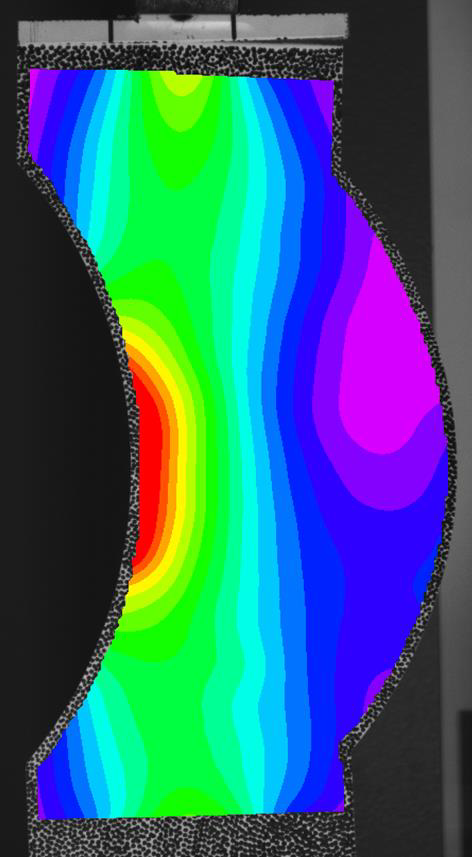
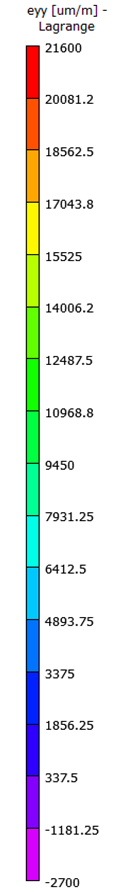
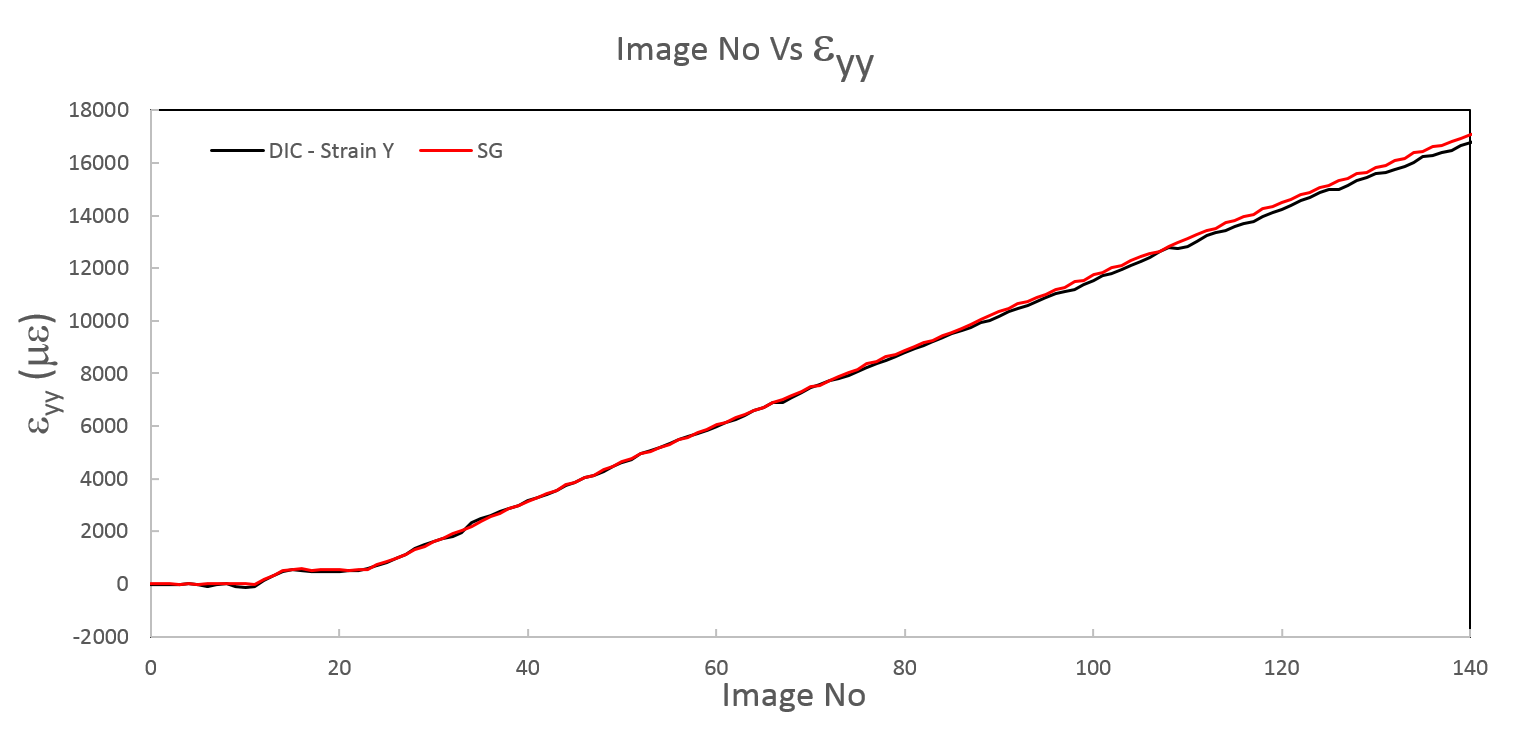
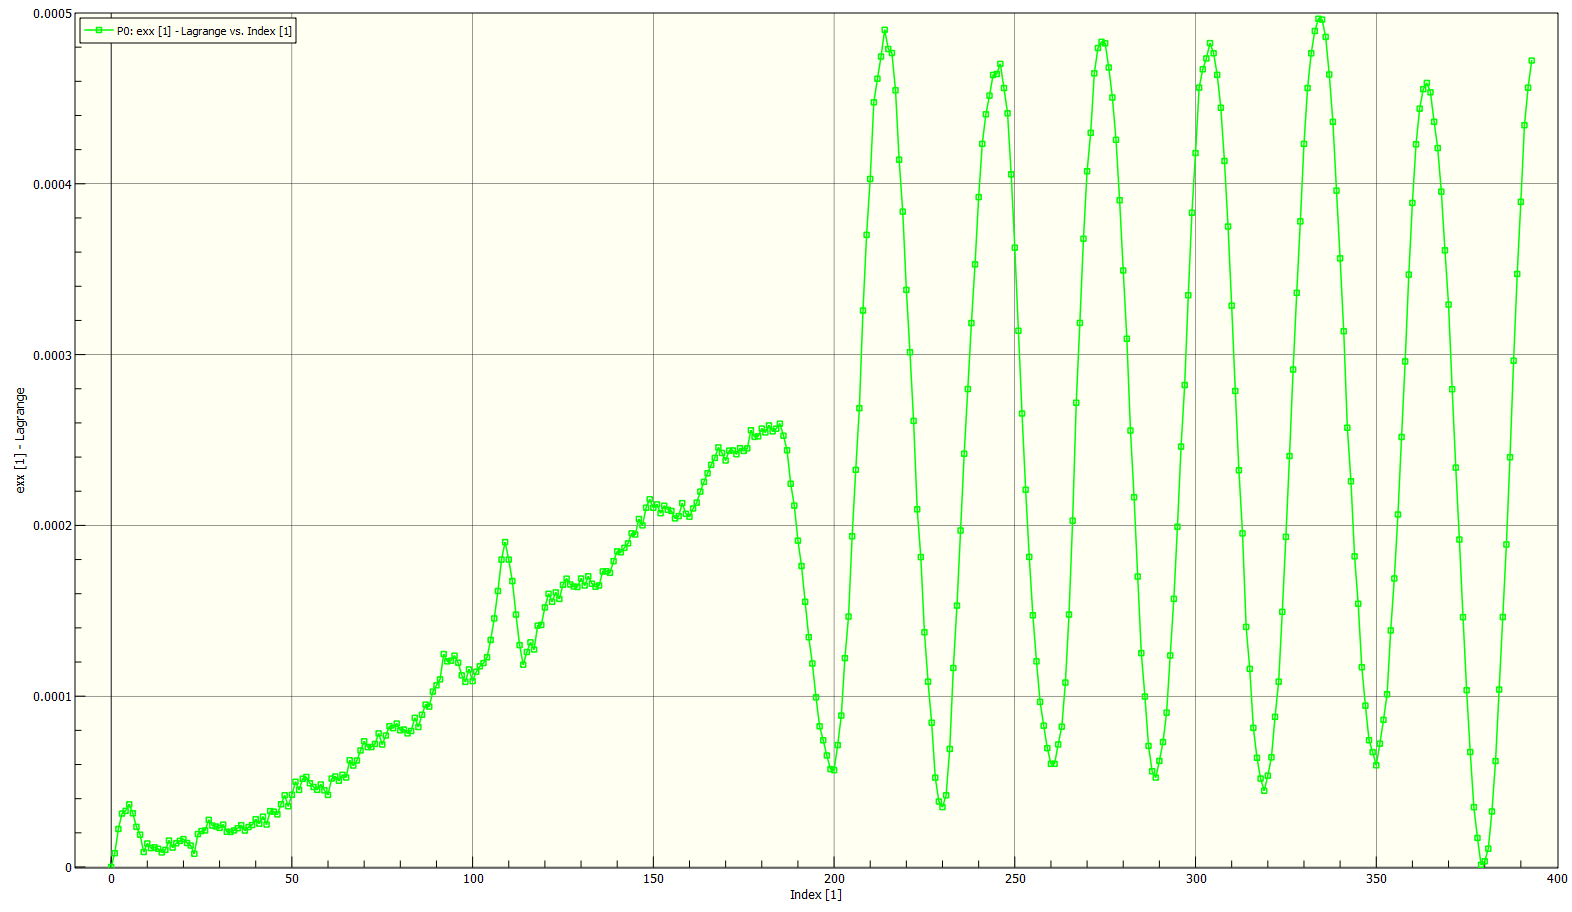
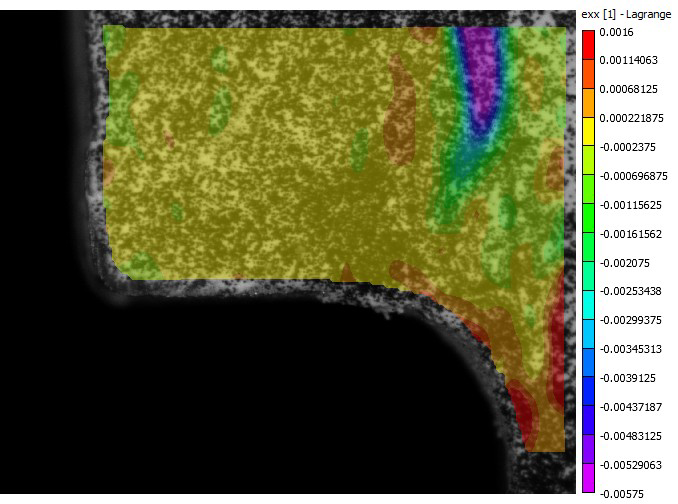
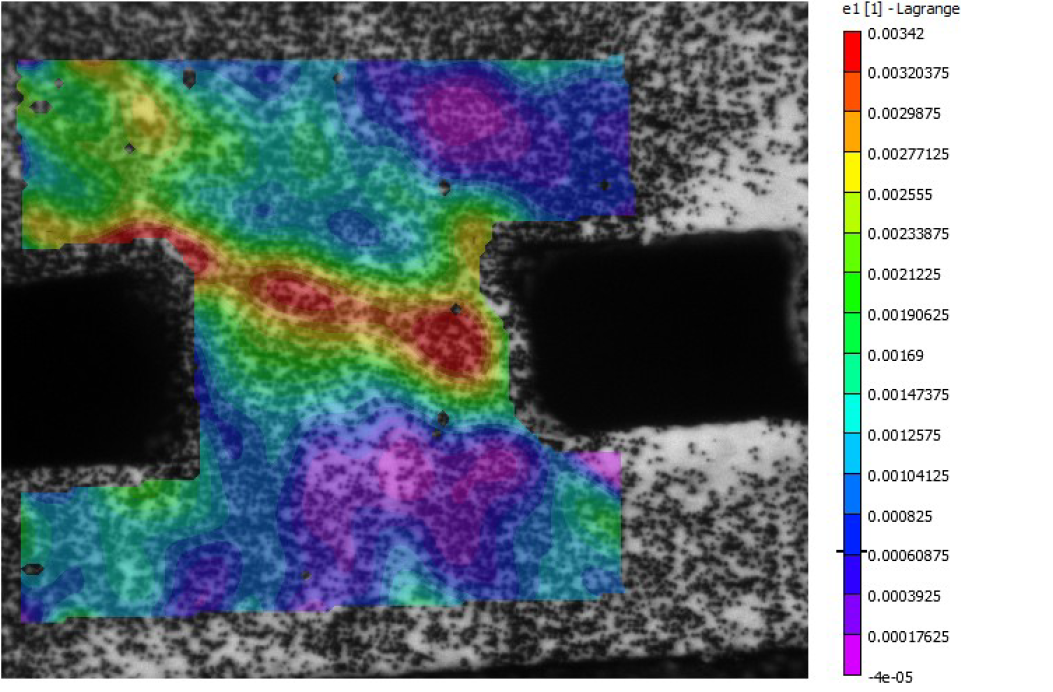
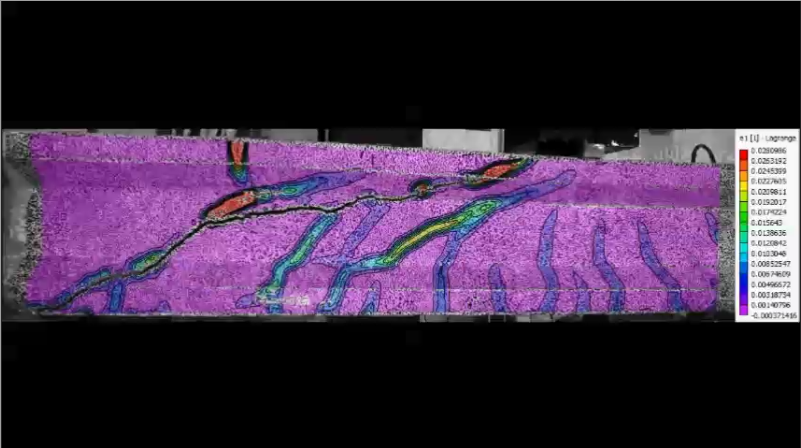
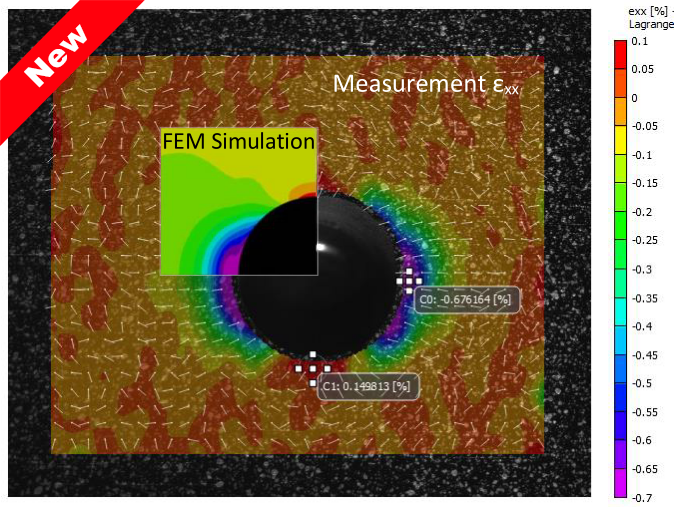
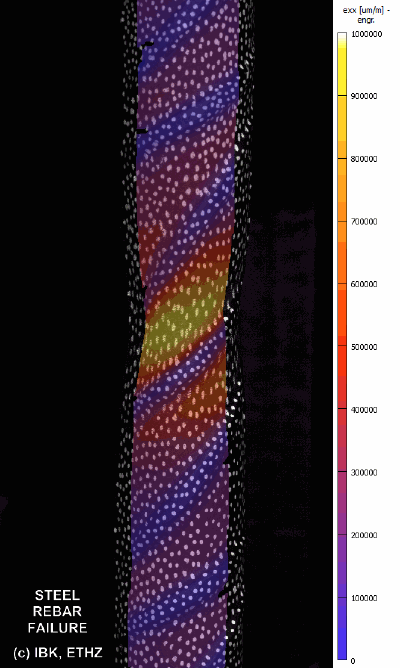
 

Nokia2