Strain Gauge Comparison

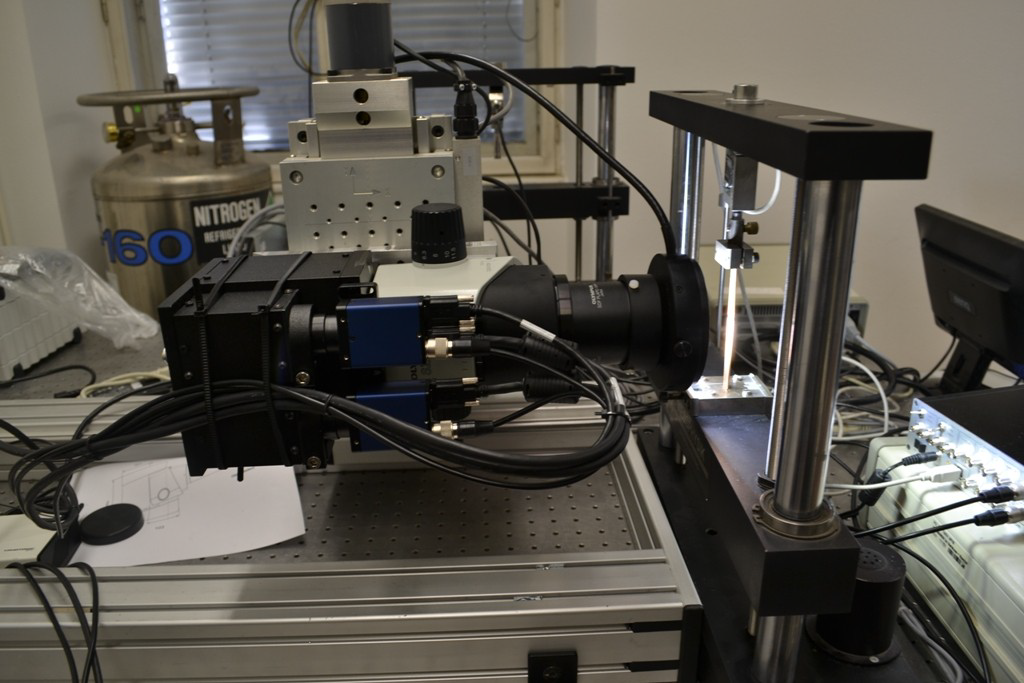
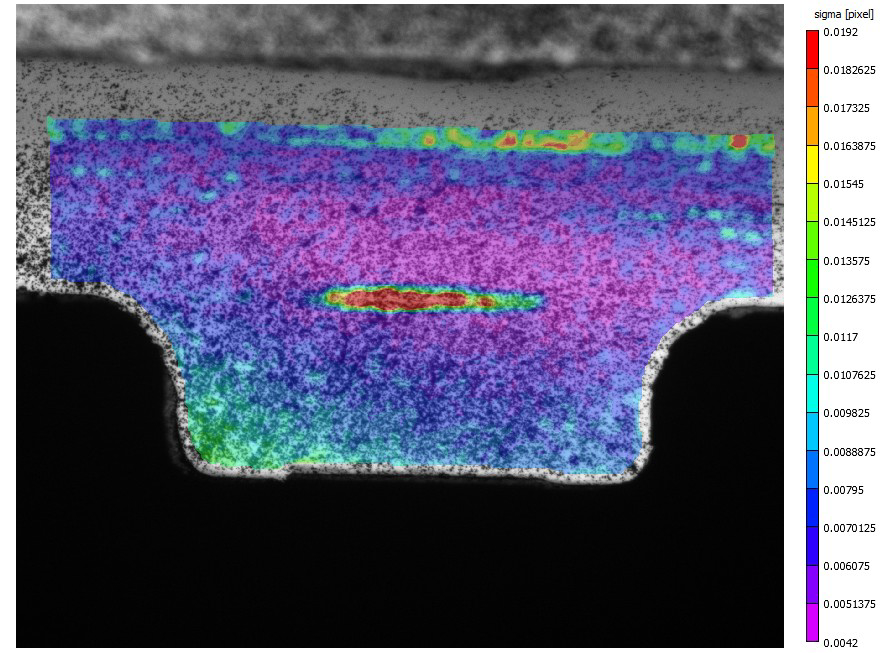
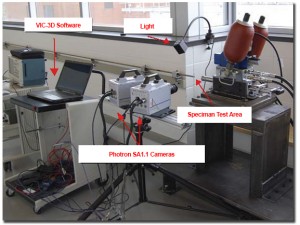
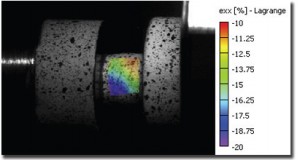
In this example a Vic-3D measurement with 5MP CMOS Camera was performed. The acryl specimen is fixed in a tensile testing machine. A strain gauge is attached at the back in combination with a SCAD 500 strain gauge amplifier. The output of the SCAD 500 was connected to the DAQ of the DIC system. The strain results are recorded parallel with the Vic-3D measurement and plotted in a diagram. The camera type is equipped with Sony 5Mpx Pregius sensor, 75 fps.

Strain Gauge Comparison-1  Strain Gauge Comparison-1a

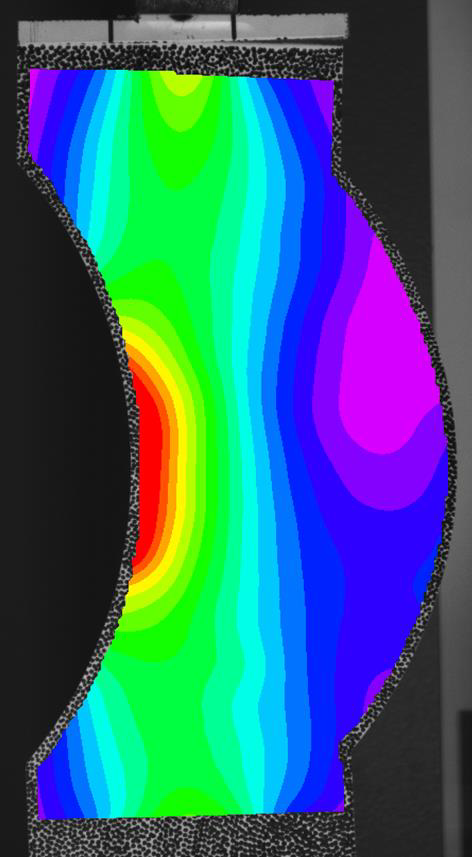
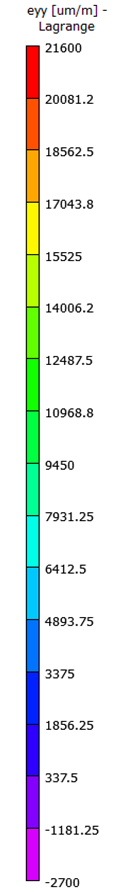
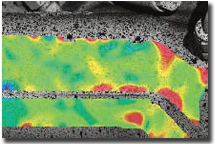
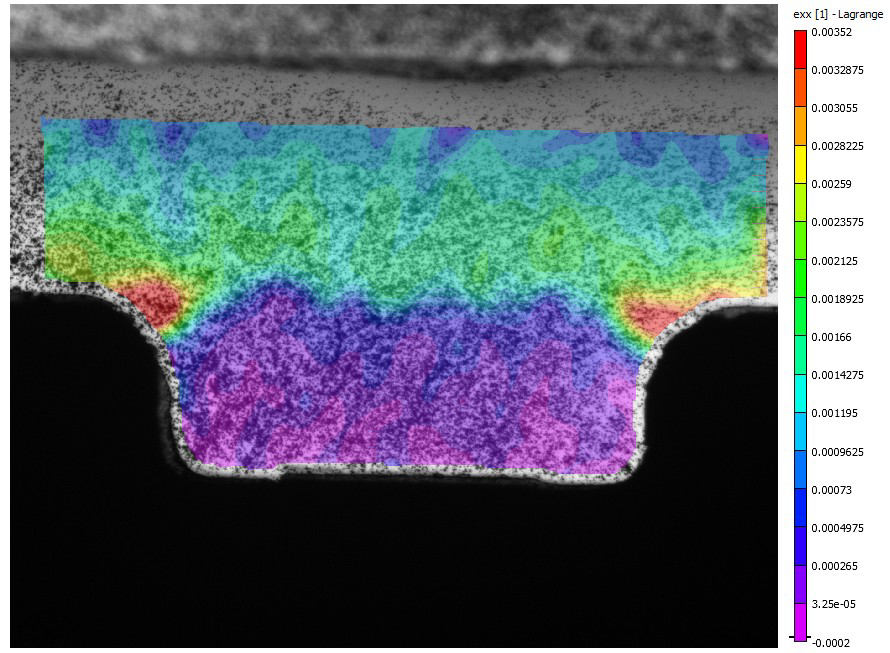
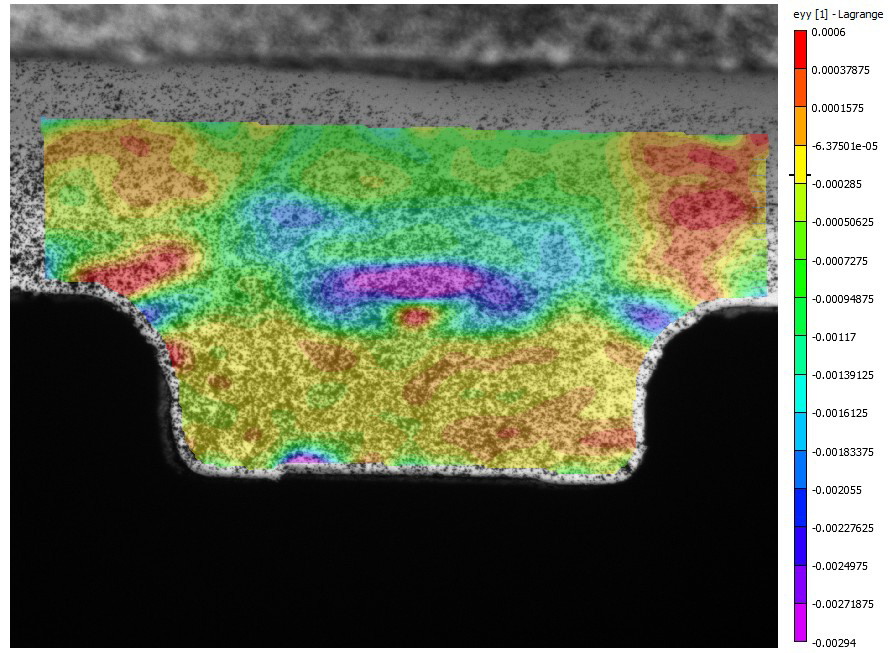
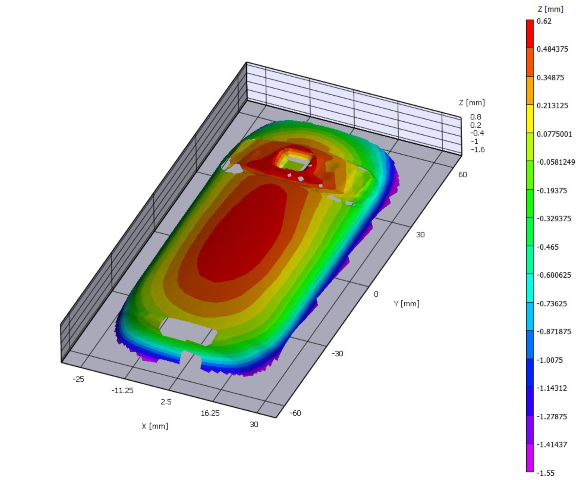
Image 1: Vic-3D measurement of the acryl specimen

Strain Gauge Comparison-2

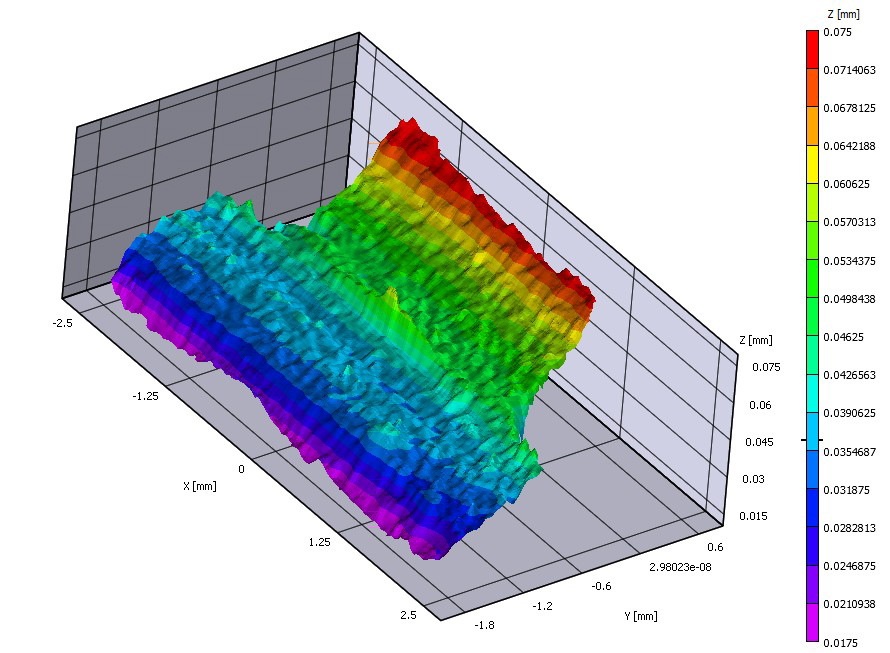
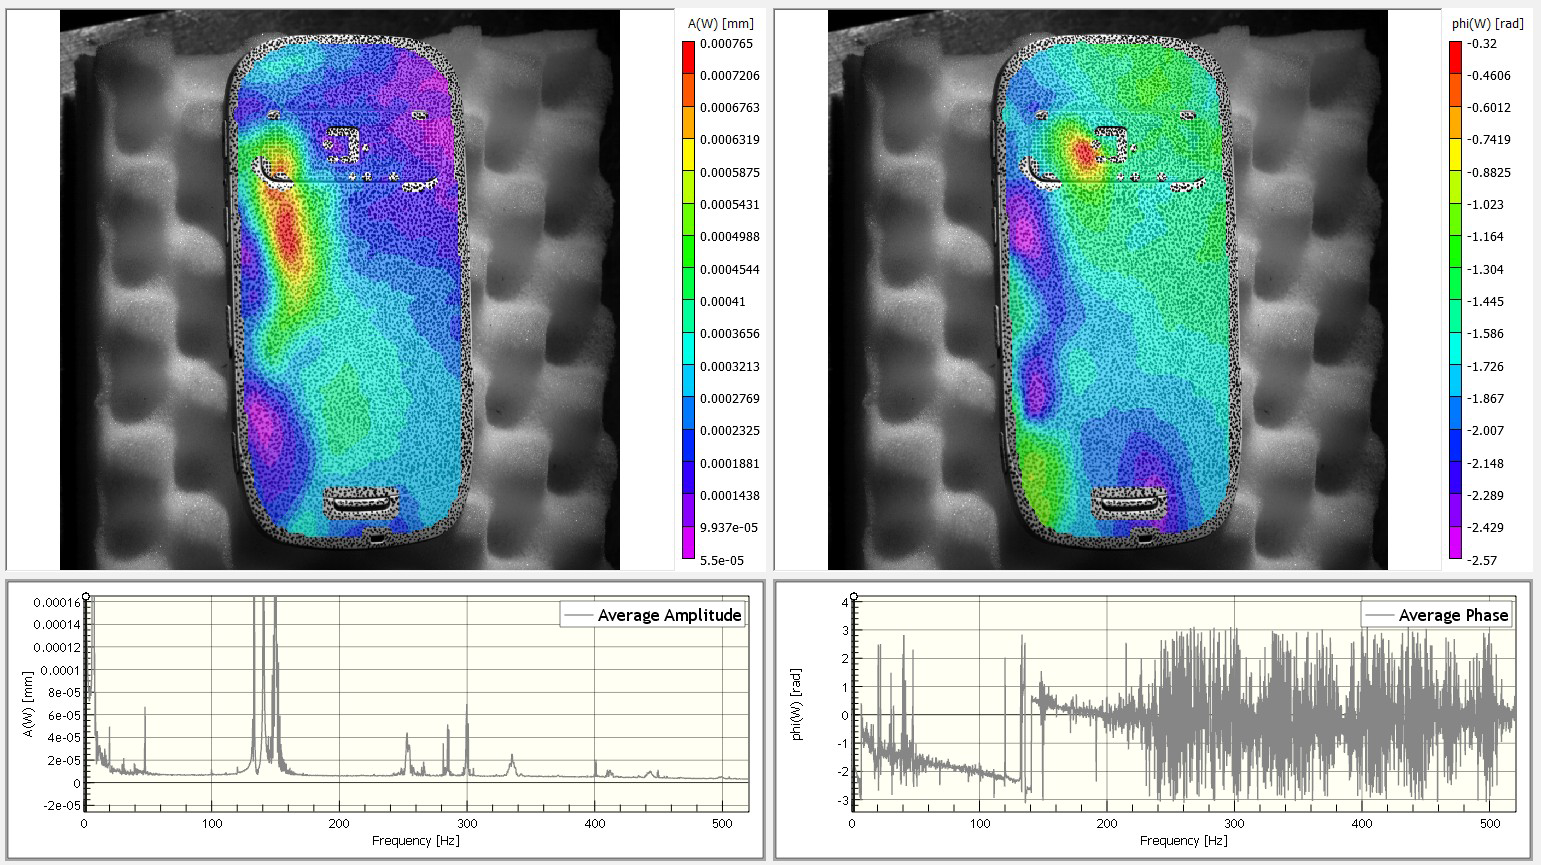
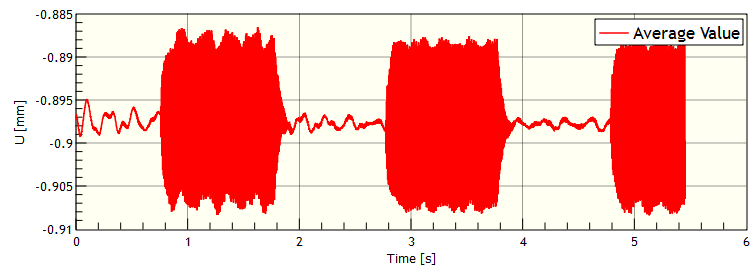
Image 2: Comparison of strain gauge data (red curve) and DIC Strain data (black curve)

The Vic-3D data match nearly perfect with the strain gauge data. Even at low strains the difference is less than 25 micro strain.

Operation mode analysis on a mobile phone during vibration alert

Nokia3

x

Reference coordinates and contour of the mobile phone.


x


This article describes the measurement and analysis of the operation deflection shapes and rigid body vibration motions of a mobile phone excited by its vibration alert. The mearurement is done, using a non contact, 3D, full-field, high speed stereo image correlation system in combination with the new Vic-3D FFT module analyzes the recorded deformation data in the frequency domain by phase-separation method.

Nokia

The measured deformations and displacements during the vibration alert are evaluated against the reference state for each stereo image pair. In this case the recording time covers about 5,5 seconds with 1000 FPS corresponding to about 5500 single measurements.

The following figure show the average vibration amplitude U.


Nokia2

Dynamic Compression of Metals

Dynamic compression

Studying the behavior of metals during a high-speed dynamic compression event has always been challenging due to the complex test set up and fast data capture rates required. Currently, very little literature is available regarding deformation behavior at strain rates of  10 to 500s-1. Utilizing high-speed cameras, the Vic-3D HS system can be used to quantify the surface displacements and strains in three dimensions over the entire field with great precision. Digital Image Correlation (DIC) has gained widespread popularity over recent years in such high-speed applications due to its high accuracy, flexibility and ease of use.


Dynamic compression2In this example, a 6mm diameter cylindrical specimen was compressed at a strain rate of 50s-1. The Vic-3D HS system was used to capture the  surface displacements and  strains on  the  specimen during the event. A random speckle pattern is applied to the specimen that allows the analysis software to easily track the deformation to sub-pixel accuracy. Although the high- speed cameras are capable of much higher capture rates, for this test they were set to an appropriate frame rate of 14,400fps to maximize spatial resolution while acquiring an adequate number of images during the event. The cameras were post-trigger at a resolution of 1024 x 400 pixels. After the event, the images are transferred to the computer’s  hard  drive, and  then  post-processed using Vic-3D analysis software.

Images courtesy of Amos Gilat & Jeremy Seidt at Ohio State University.


Contractions of a Muscle

Biomechanic researchers were studying the contractions of a rat Tibialis Anterior muscle.  It was desirable to quickly and accurately quantify the overall movements, as well as localized variations.

Challenges

Because the experiments involved live tissues, conventional gauges were difficult to apply and tended to interfere with the motion under study.  It was important to capture data quickly, and for as many points as possible.  Marker tracking had been used, but provided only gross averages.  It was also time-consuming and tedious for the researchers to process this type of  information.

Solution

The Vic-3D system was used to rapidly capture contraction data over the entire muscle surface.  Due to the system’s speed and simplicity, it was possible to make numerous measurements at precisely timed intervals.  There was no interaction with the specimen, and no need to guess which areas would be of greatest interest.

The resulting measurements provided high spatial resolution and made it possible to identify numerous areas where “bunching” of the muscle tissue caused significant variations in muscle contraction.  These areas had not been previously identified with conventional methods.  Finally, all calculations were done automatically.  This saved considerable time and avoided the possibility of human error in the data processing.

Deformation Measurement

Aerospace Application Example

aerospace_1_notitle-300x247Airbus has built a reputation for innovative aircraft, recognized around  the world for their safety and efficiency. All of these attributes are driven by a top-notch testing program, whose innovative practice are evidenced by their use of the Vic-3D measurement system.

One of the goals of the Airbus testing program is to characterize the structural damage caused by collisions between the aircraft and small projectiles such as birds and other ground based debris, and to ensure that the structural integrity of the aircraft is maintained.

This type of event can be reproduced by firing a variety of different types of projectile at a piece of aircraft structure at a high velocity. The results obtained can be used to compare with computer models of the structure under impact loads, leading to more highly optimized and safer designs.


aerospace_2_notitle-300x224
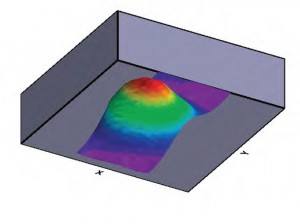
Dr. Richard Burguete, experimental mechanics specialist at Airbus UK since 1997, explains the benefits of this approach as follows: “The VIC-3D system allows us to be sure we have captured all of the relevant data, some of which might have otherwise been unobtainable.”

Vibration Analysis of a Brake Disc

Bremsen1 Bremsen2
 x
Automobiles are subject to many forces using operation. Vibrations from the engine or the road-surface transmit through the vehicle’s chassis and suspension to the most essential mechanical component of the vehicle, the brake system.

Bremsen3

In this example, a 14” diameter brake disc from a heavyduty truck was excited using a small hammer to measure the vibration shapes of the rotor. The three-dimensional operational deflection shapes were easily identified and measured using the Vic-3D™ HS Vibration Analysis System. Amplitudes as small as 40 nanometers were measured at a frequency of approximately 2,000 Hz.


Strain Measurement on a Gearwheel

Challenges

Assembled components typically have complex interactions with one another. Contact points can vary during operational cycles due to part movement. This means that the locations of peak strains can be hard to predict, and they are often not stationary. The movement of parts can also make it impractical to maintain electrical connections with gauges. Even when they are stationary and easy to locate, the highest strains can be concentrated in very small areas or have high gradients. Peak values may be lost to the averaging effect produced by gauges.

Solution

Vic-3D provided a means for making strain measurements across the entire profile of the gear tooth. Because it provides full-field measurements, it was not necessary to choose a particular point at which measurements would be made. This allowed the peak strains to be clearly visualized and accurately measured at various stages of the operational cycle. Vic-3D also measured displacement in three dimensions. This feature allowed our customer to recognize and quantify twisting of the gear tooth under load.

Exhaust pipe

Exhaust1
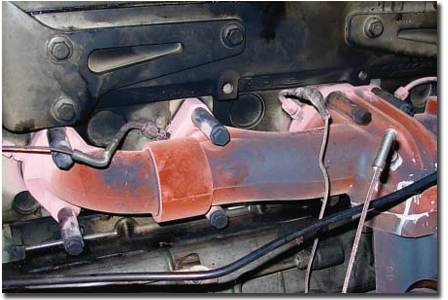
The engineers at Cummins design and test their engines to withstand real-world conditions, ranging from military deployments to heavy-duty industrial sites. Cummins engineers want to know exactly how their parts are deforming under the combination of thermal and mechanical loads. This means they’ve got to perform their tests with the engines running – and hot.

Because of the complex strain fields produced under these conditions, conventional gauges cannot satisfy Cummins’ requirements. FEA simulations are also limited, due to the uncertain boundary conditions. With the Vic-3D system, Cummins engineers are able to obtain detailed three-dimensional strain measurements. These measurements are made under real loading conditions while the engine is running. In addition, the Vic-3D system is easy to set up and can measure both small parts and large assemblies.


 ………………………………………………………………………………

exhaust2

Paul Gloeckner, senior research engineer at Cummins, explains the usefulness of the Vic-3D system as follows: “This tool allows us to make measurements that were previously not possible. It has also allowed us to considerably reduce the time required for these tests.”

Microscopic Strain Measurement

Combination of a special stereomicroscope with Vic-3D digital image correlation on electronic components.


Uni Wien Mikroskop

Measurement set up: Stereo microscope mounted

on x-y-z-microtable (backside) and tensile machine (right).


Uni Wien Mikroskop2

Uni Wien Mikroskop3

Servered ceramic capacitor chip under bending load (image width approx. 4mm):
Strain in x-direction (upper image) and y- direction (lower image).


Uni Wien Mikroskop4

Uni Wien Mikroskop5

Standard derivation (upper) under load : An increased value occurs on the middle against the reference
state by the locally small bulge at the contact between chip and board (see 3D conture below). This might be caused
by material , which is pressed together between the two parts (including the colour layer). In the upper area the
increased values of the standard derivation is caused by the reduced speckle density.